WeatherOrb
One weather brain for sky and sea: eleven forecast models on one machine, blended into a single field, and rendered as a map that can be scored against the store behind it.
The models are synced from Open-Meteo’s public archive. Six atmospheric members are regridded onto a common 0.0625° grid and published as one pseudo-model, weatherorb_blend — the layer the map opens on. The field is rebuilt every three hours; the last full round took 5,729 s over a 92 GB store, and the catalogue it serves is 136 layers across 15 models, the wave fleet and three static atlases included.
The blend is more than an average with a better name. Temperature and humidity weight the local model first while its own lead is under six hours, equally after. Precipitation and clear sky ship as agreement — the share of members over the threshold — because the members’ disagreement is the one signal no upstream hands over. Where a single member covers a cell, that cell keeps its value and its spread stays undefined.
Nothing is smoothed to look finished. A layer with no data draws nothing, an hour a model does not carry is null, and a scoring factor with no input drops out with its coverage saying so.
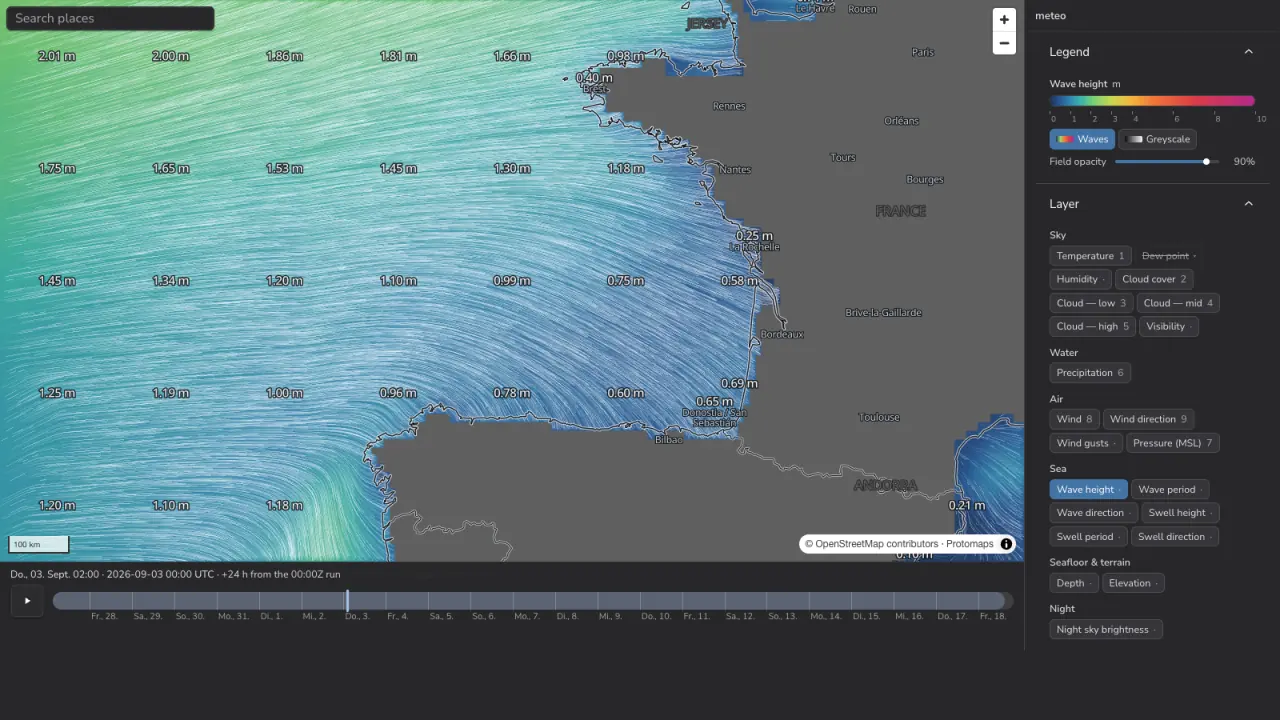
Bars it passes
| Bar | Measured |
|---|---|
| Point probe against the upstream API | 12/12 points, |probe − API| = 0.0 |
| Rendered pixel against an independent LUT decode | 40/40 canvas pixels within 2 channel steps |
| Temperature field against Windy’s own decoded field | corr 0.996, bias −0.06 °C, RMSE 0.57 °C over 66k px |
| Wave height against Windy’s own decoded field | corr 0.998–0.9998, RMSE 0.012–0.036 m |
| Cloud blend against its best single member | CRPS 53–60 % better at 3/3 stations |
| Precipitation agreement against its best member | Brier 0.066 against 0.098 |
| Clear-sky agreement against its best member | Brier 0.126 against 0.177 |
| Render, four seconds of continuous pan | median frame 11.3 ms, p95 27.1 ms, with raster and particles |
The Windy comparison is field against field, not screenshot against screenshot: their tiles carry the scalar with a per-tile range map, so both sides decode to physical units before anything is differenced. At the cell pitch their pyramid stops at zoom 4; this one serves measured data to zoom 8.
Open the mapForecast data from Open-Meteo’s AWS Open Data mirror. Basemap from Protomaps and OpenStreetMap. Bathymetry from EMODnet DTM 2024 and GEBCO 2026; night sky from the Lorenz Light Pollution Atlas 2025.